Atomic Profit and Loss Statement
The Atomic Profit and Loss report provides granular insights into your business profitability by breaking down revenue, costs, and profits at the individual item level. Unlike traditional P&L statements that aggregate by account categories, this report shows profitability per item, allowing you to identify your most profitable products and services.
This report calculates key metrics including revenue, Cost of Goods Sold (COGS), gross profit, profit margin percentage, and contribution percentage for each item sold. It uses historical purchase data to determine the average cost of items, which is then used to calculate COGS for each sale.
Here are some insights you can gain from this report:
- Identify your most profitable items by revenue and gross profit
- Understand which items have the highest profit margins
- Determine which items contribute most significantly to overall profitability
- Track item-level performance over specific time periods
- Make informed decisions about inventory, pricing, and product focus
To access this report, navigate using the sidebar: Reports > Atomic Profit And Loss
Filters
The Atomic Profit and Loss report offers several filters to customize your analysis:
From Date
Sets the starting date for transactions to be included in the report. Only sales and purchase transactions occurring on or after this date will be considered in the calculations.
To Date
Sets the ending date for transactions to be included in the report. Only sales and purchase transactions occurring before this date will be considered in the calculations.
Item Type
This filter allows you to specify which types of transactions to include in the report:
- Sales - Show only sales transactions
- Purchase - Show only purchase transactions
- Both - Include both sales and purchase transactions (default)
Group By
This determines how the data is aggregated in the report:
- Item - Groups results by individual items (default)
- Party - Groups results by customer/supplier
- Account - Groups results by accounting account
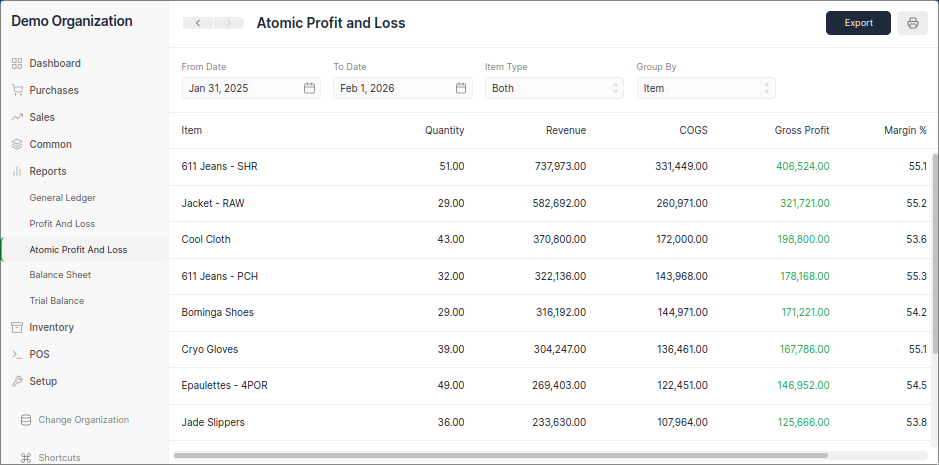
Report Columns
The report displays the following columns for each item:
Item
Shows the name of the item as recorded in your sales transactions. This column identifies the specific product or service being analyzed.
Quantity
Displays the total quantity of the item sold during the selected period. This represents the sum of all units sold for that particular item.
Revenue
Shows the total revenue generated by the item during the selected period. This is calculated as the sum of all sales amounts for the item from sales invoices.
COGS (Cost of Goods Sold)
Displays the estimated cost of goods sold for the item during the selected period. This is calculated using the average cost of the item based on purchase invoice data.
Gross Profit
Shows the gross profit for the item, calculated as Revenue minus COGS. Positive values indicate profitable items, while negative values indicate items sold at a loss.
Margin %
Displays the gross profit margin as a percentage, calculated as (Gross Profit / Revenue) × 100. This indicates the percentage of revenue that remains after accounting for the cost of goods sold.
Contribution %
Shows the contribution of this item to the total gross profit of all items, calculated as (Item Gross Profit / Total Gross Profit) × 100. This helps identify which items are the biggest contributors to your overall profitability.